Getting Started
Installation
kneed requires Python 3.8 or later.
What is a Knee Point?
A knee point (or elbow point) is the point of maximum curvature on a curve — the spot where the rate of change shifts most dramatically. It's commonly used in machine learning to determine optimal parameters, such as the number of clusters in K-means or the number of components in PCA.
Minimal Example
from kneed import KneeLocator, DataGenerator
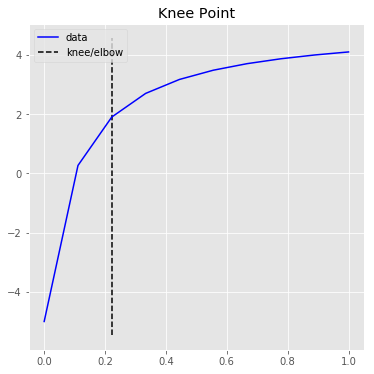
# Generate sample data (Figure 2 from the Kneedle paper)
x, y = DataGenerator.figure2()
# Find the knee point
kl = KneeLocator(x, y, curve="concave", direction="increasing")
print(kl.knee) # 0.222 — the x value of the knee
print(kl.knee_y) # 1.897 — the y value at the knee
Choosing curve and direction
The two most important parameters are curve and direction:
| Parameter | Values | Description |
|---|---|---|
curve |
"concave" or "convex" |
Concave curves have knees, convex curves have elbows |
direction |
"increasing" or "decreasing" |
The overall trend of the data from left to right |
Tip
Not sure which values to use? Let kneed auto-detect them:
from kneed import find_shape

direction, curve = find_shape(x, y)
kl = KneeLocator(x, y, curve=curve, direction=direction)
See the find_shape guide for details.
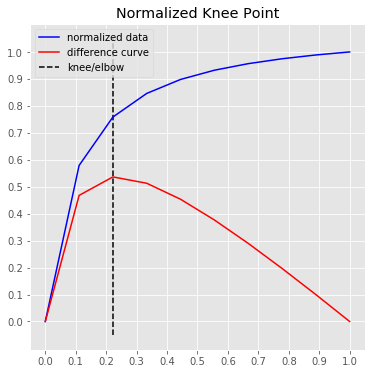
Visualizing Results
kneed includes two built-in plotting methods (requires pip install kneed[plot]):
Next Steps
- Parameters Guide — learn how to tune sensitivity, interpolation method, and more
- Curve Types — visual guide to all four curve/direction combinations
- Real-World Examples — K-means elbow method, PCA, and more
- API Reference — full class and method documentation